


Lifecycle of algorithmic trading portfolio
Running trading strategies on a live Forex account is a very important part of real algorithmic trading, that benefits not only those who use platforms for their trading like StrategyQuant X, but also every algorithmic trader. This article will include techniques that on applying will give a wider view on how trading robots are behaving in a real environment and at least but not last, improve trading results.
Algorithmic trading is characterized over other trading approaches by giving the possibility of having a detailed view of what is happening with the running trading robots. very trade and order can be managed on an unlimited number of trading instruments simultaneously. The key now falls in the way of getting the most out of this advantage. in other words, the cornerstone is not just collecting data, but how to evaluate collected data and obtain real outputs for real trading. So, let’s start;
The life cycle of algorithmic trading portfolio
On coding a Forex trading robot either using a strategy builder for that or not, its algotrading lifecycle passes through five milestones likin the graph above. All start with getting a portfolio of trading robots. It's not recommended to use just one robot for that as diversification is so important for the success of algorithmic trading and it can b achieved by using multiple robots. Portfolio composition can b discussed in a separate article.
Next, you will need to prove the strategies in the real market even if it was created in the best possible way, some issues might still exist and won't be discovered till the robot starts to deal in the real money world. The testing period will let you discover these bugs and give you a better idea of what is expected from the engaged trading strategy. By gathering enough real data, you can then decide what should be changed in the portfolio, in a process that will be discussed later in this article.
Now the valuation has been completed and the strategy can b applied live. Live trading valuation should be continued, and we will discuss it in detail. Basically, the two moments you should compare live trading results with the backtest are at the end of the testing period and three months after deploying the strategies live. A periodical check that can b regularly once a year is very important too.
Monitoring live trading results
The first step in this process that follows starting live trading on your trading platform is registering your trading account in one of the online monitoring platforms like FXBlue or MyFxBook, the first offers easy access to all necessary statistics, so it will b used in this presentation. It's shown in the graph below disclosing how to export your live account trading history into a CSV file, this saved report will b used in the further steps of this tutorial.

The FxBlue.com free online monitoring platform

Export of live trading results into a CSV text file
Bulk Comparing of live and backtests results using Quant Analyzer “Compare results” module
With Quant Analyzer software “Compare results” module, a bulk comparison of live strategy results and backtest obtained from multiple sources can b performed to introduce several scenarios.
How does the “Compare results” module work?
It allows comparing multiple results between trading platform / live results and backtests in StrategyQuant X / AlgoWizard.
This can be done manually by loading each report into Quant Analyzer and then combining it in the portfolio, but this new module can do it automatically for all files at once.
There is a new icon Compare results on the top left

“Compare results” Quant Analyzer module
Configuration of the “Compare results” module
- Folder 1
The folder containing live results or backtests from the trading platform – Tradestation, MetaTrader, MyFxbook, FxBlue, etc. All the formats that Quant Analyzer recognizes are supported - Folder 2
The folder containing backtest of strategies from StrategyQuant X / AlgoWizard. It recognizes .sqx and .str format. - "Load only main results" checkbox
The .sqx file can contain multiple results from cross-checks or additional markets, that's why this checkbox option exists, so when unchecked, these results would be loaded together as a portfolio. By default, it should stay checked. - How to match results
- Match by name – means that for every file in Folder 1 it will try to find a file with the same name in Folder 2. When found, these two results are then combined into a portfolio.
- Match by Magic Number – This can be used when you have reports for example from MyFxbook / FxBlue that contain a list of trades for multiple strategies, distinguished by their Magic Number.
With this option, it will recognize all Magic numbers from the reports loaded from Folder 1, and it will try to find strategies in Folder 2 that have this Magic Number in their name.
So for example, if Magic Numbers are 12345, 76543 then it will look for files with strings “12345” and “76543” in their names in Folder 2. If found, it will combine these found results into one portfolio.
Performing the comparison of the results
When you click on the "Compare" button it will perform the comparison and writes the log. All the comparison results are stored in the Portfolios databank.

Performing results comparison

Result comparison graph
In this example, the backtest of strategy in TradeStation (first blue line) was compared with the backtest in StrategyQuant X (second, red line). Some differences in trading can be seen but the equities are quite close to each other.
-
Tip: Setting symbol definition during importing the report
Many brokers use their own symbol syntax that might not be defined in the Quant Analyzer setting file. In such a case, Quant Analyzer want be able to recognize them when you load a report of your account into it. Here is how to define all symbols at once in the Quant Analyzer setting file:

Matching symbol’s definition in Quant Analyzer
- Open this file C:\QuantAnalyzer47\settings\ PredefinedSymbols.csv in a text editor.
- Add a new line with your instrument settings at the end of the configuration file as in this example:
30;DE.30;25;1;0.1
FDE30;FDE30;25;1;0.1
ES;ES;50;0.25;0.25 - Save the changes and restart Quant Analyzer.
-
Tip: Switch results to show them in pips
Results presentation should b switched from money to pips for correct comparison of results.

Switch presentation of results from "money" to "pips"
Examples of different result comparison scenarios
-
Scenario: Compare fxblue live data with StrategyQuant X
This is the most common scenario for the traders who use StrategyQuant X for creating strategies:

Compare fxblue live data with StrategyQuant X

Comparison graph: Greenline is the backtest and the red line is the result from FxBlue. You can see that backtest is quite short compared to the live results. Regarding Live/BT accuracy results matches well
- Set path to the folder with fxblue results file (Discussed in “Monitoring live trading results” chapter).
- Set path to the folder with backtests.
- Set matching by magic number.
- Click on load live result.
- double-click on the result in the databank.
-
Scenario: Compare Metatrader 4 backtest data with FxBlue
If you have a trading robot in MT4/MT5 code and you can perform backtest in MetaTrader, this scenario can be employed. Noting that most brokers do not provide long enough historical data for the trading symbols, but the free QuantDataManager can give you access to a longer history. Continuing with the comparison, steps are similar to the previous scenario:

Comparing MT4/5 and FxBlue results

On the image, you can see that results fit almost perfectly
- Select FX blue report.
- Select MT4 report.
- Set comparing by magic number or backtest name.
- Click on Load live results files.
-
Other scenarios
TradeStation live report can also be loaded and compared with strategies generated in StrategyQuant X. MT4 backtest results can also b compared with StrategyQuant X results. Numerous ways how to use this module exist.
Comparison results in interpretation – When to stop trading strategy?
Real results will be usually slightly worse than the backtest as real trading always involves slippages, spikes, etc. So the percentage of similarity between the backtest trades and the real ones greatly matters! Significant differences between them indicate that we should stop trading this strategy, as there is some discrepancy in the execution of the logic of the strategy, while if the matching for example reaches 80%, it is then confirming the quality of the strategy.
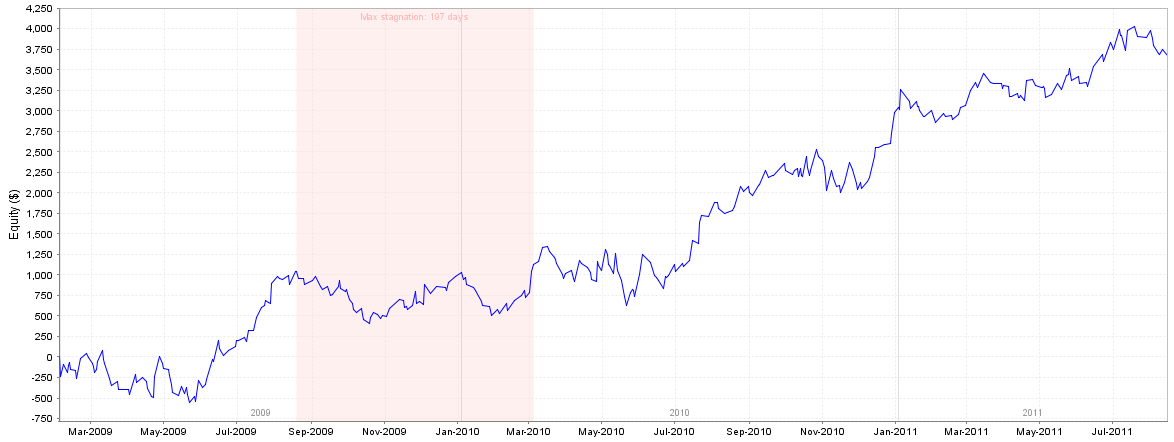
Live results deviation from the backtest can be seen in the graph below. A red rectangle mark on a situation during the testing period suggests stopping to trade the strategy.

Real-backtest results mismatch
How to evaluate live performance compared to backtest?
Besides matching the results, one more important aspect is needed to be evaluated during live trading, especially while evaluating the testing period. It is comparing a live performance to backtest where the overall profit of a trading symbol e.g. EURUS, can be taken and compared with the backtest to find out the percentage of real performance to the backtest that could be for example 70%. Generally, 70% up to 100% is fine as live conditions are always tougher than the ideal backtest. But if that percentage falls to 30%, then further research is needed to find a reason for this inconsistency, which could be for example lack of liquidity on the symbol which leads to big slippages.
Conclusion
Several years ago, there was a lack of methodology and tools to evaluate live results. Many custom solutions exist now for that purpose for everyone with a wide range of supported platforms like Quant Analyzer. This article focused on practical examples as well as on rules on how to evaluate results during live trading. Having good rules will help you to make clear decisions during your lifetime of portfolio and will allow you to be more consistent with your results.

Latest Quant Analyzer Posts
MyFxBots Admin
[Last Modified On Thurs, 2 Sep 2021]Other StrategyQuant X Forex Robots


Talk about Quant Analyzer
Information, charts or examples contained in this blog post are for illustration and educational purposes only. It should not be considered as an advice or endorsement to purchase or sell any security or financial instrument. We do not and cannot give any kind of financial advice. No employee or persons associated with us are registered or authorized to give financial advice. We do not trade on anyone's behalf, and we do not recommend any broker. On certain occasions, we have a material link to the product or service mentioned in the article. This may be in the form of compensation or remuneration.
Tags
Forex Combo System WallStreet Forex Robot 3.0 Domination Forex Striker Omega Trend Forex Megadroid Broker Arbitrage FX-Builder Forex Diamond Volatility Factor Pro GPS Forex Robot Tick Data Suite Vortex Trader PRO Forex Trend Detector Forex Trend Hunter Swing Trader PRO RayBOT Forex Gold Investor FXCharger Best Free Scalper Pro Gold Scalper PRO News Scope EA PRO Smart Scalper PRO FX Scalper Evening Scalper PRO Waka Waka Golden Pickaxe Perceptrader AI Happy Bitcoin Traders Academy Club Forex EA Lab Forex Mentor PRO AlgoWizard Quant Data Manager Traders Elite Forex Trendy FXAutomater InstaForex RoboForex IronFX Tickmill FXVM Alpari FX Choice TradingFX VPS Commercial Network Services QHoster GrandCapital IC Markets FBS FX Secret Club StrategyQuant X Automated Forex Tools Happy Forex LeapFX Trading Academy ForexTime Magnetic Exchange XM BlackBull Markets ForexSignals.com Libertex AMarkets HFM Broker FxPro Binance ACY Securities IV Markets MTeletool Forex Store Valery Trading EA Trading Academy Expert Advisor Studio Forex Strategy Builder Express Generator EGPForex
Risk
Forex trading can involve the risk of loss beyond your initial deposit. It is not suitable for all investors and you should make sure you understand the risks involved, seeking independent advice if necessary.
Forex accounts typically offer various degrees of leverage and their elevated profit potential is counterbalanced by an equally high level of risk. You should never risk more than you are prepared to lose and you should carefully take into consideration your trading experience.
Past performance and simulated results are not necessarily indicative of future performance. All the content on this site represents the sole opinion of the author and does not constitute an express recommendation to purchase any of the products described in its pages.